Thorpewood Survey Results – October 2024
Thorpewood carried out a patient survey during the first two weeks of October. This survey was identical to the one that we carried out in April 2024 as we wanted a direct comparison to understand if we have improved the experience for our patients. The survey was carried out face to face with patients and was also available online.
Over the course of the two weeks, 961 surveys were completed.
The table below shows the average rating, out of five, for each of the questions asked:
| Rate your overall experience: | Quality of care: | Staff attitude/ communication: | Ease of making an appointment: | Wait time for that appointment: | Cleanliness of surgery: |
| 4.19 | 4.29 | 4.35 | 3.58 | 3.79 | 4.46 |
Comparing these scores against the results we collected in April, we can see that across the board, patients have been happier with the service they have received:
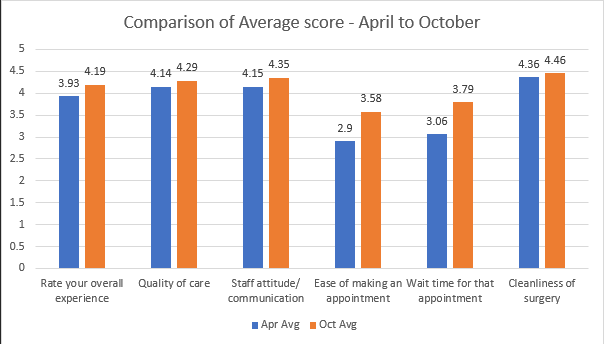
This graph shows that the average scores for each of the categories have increased from April to October. We can also see that the key areas needing improvement from our first survey, the ease of making an appointment and the wait time for that appointment, have made the biggest improvement.
These results are pleasing for us to see and show that the hard work we have put in and changes we have made are having a positive effect on the service we are providing. We acknowledge that we still have improvements to make, and we will strive to continue pushing in the right direction. Thank you to everybody who took the time to complete the survey.